

Introduction
Investors often judge a company’s performance by looking at how effectively it turns shareholder capital into profits. This is captured by the Return on Equity (ROE), a measure that shows how much income is generated per unit of equity invested. Yet while ROE summarizes profitability, it doesn’t reveal the underlying mechanics, whether those earnings result from strong operations, efficient asset management, or debt-driven growth.
To uncover these sources, analysts use the DuPont framework: a method that decomposes ROE into its key drivers and helps identify whether profitability stems from business strength or financial risk.
In this article, we’ll explore:
- What the DuPont Analysis is and how it works;
- How to calculate and interpret each component of ROE;
- A practical example of DuPont Analysis in action;
- How to analyze whether ROE changes are healthy or risky;
- And how finance professionals use it to evaluate long-term sustainability.
By the end, you’ll understand why mastering the DuPont framework is essential for anyone serious about financial analysis and valuation — from corporate finance teams to equity investors. — from corporate finance teams to equity investors.
Understanding Return on Equity (ROE)
Return on Equity (ROE) is one of the most widely used measures of profitability in finance. It tells investors how efficiently a company uses shareholders’ capital to generate profit.
ROE = Net Income
Shareholders’ Equity
In simple terms, if a company reports an ROE of 15%, it means it earns 15 cents for every dollar of equity invested. High ROE values generally suggest that a company is managing its resources effectively, while lower values may indicate inefficiency or weak profitability.
However, ROE on its own can be misleading.
If you want to go deeper into performance metrics before applying the DuPont framework, check out Financial Ratios Explained: How to Analyze Business Performance.
It provides a solid foundation on liquidity, profitability, and efficiency ratios — essential context for mastering any corporate finance analysis.
Two companies can have identical ROE figures for very different reasons — one might be genuinely profitable, while another may rely heavily on debt to boost returns. This is why analysts need to look beyond the number and understand what drives it.
That’s exactly what the DuPont Analysis does: it deconstructs ROE into its three fundamental drivers — profitability, efficiency, and leverage — revealing the true sources of performance.
By analyzing each component separately, we can see whether a company’s strong ROE comes from operational excellence, efficient asset management, or aggressive financial leverage.
The DuPont formula explained
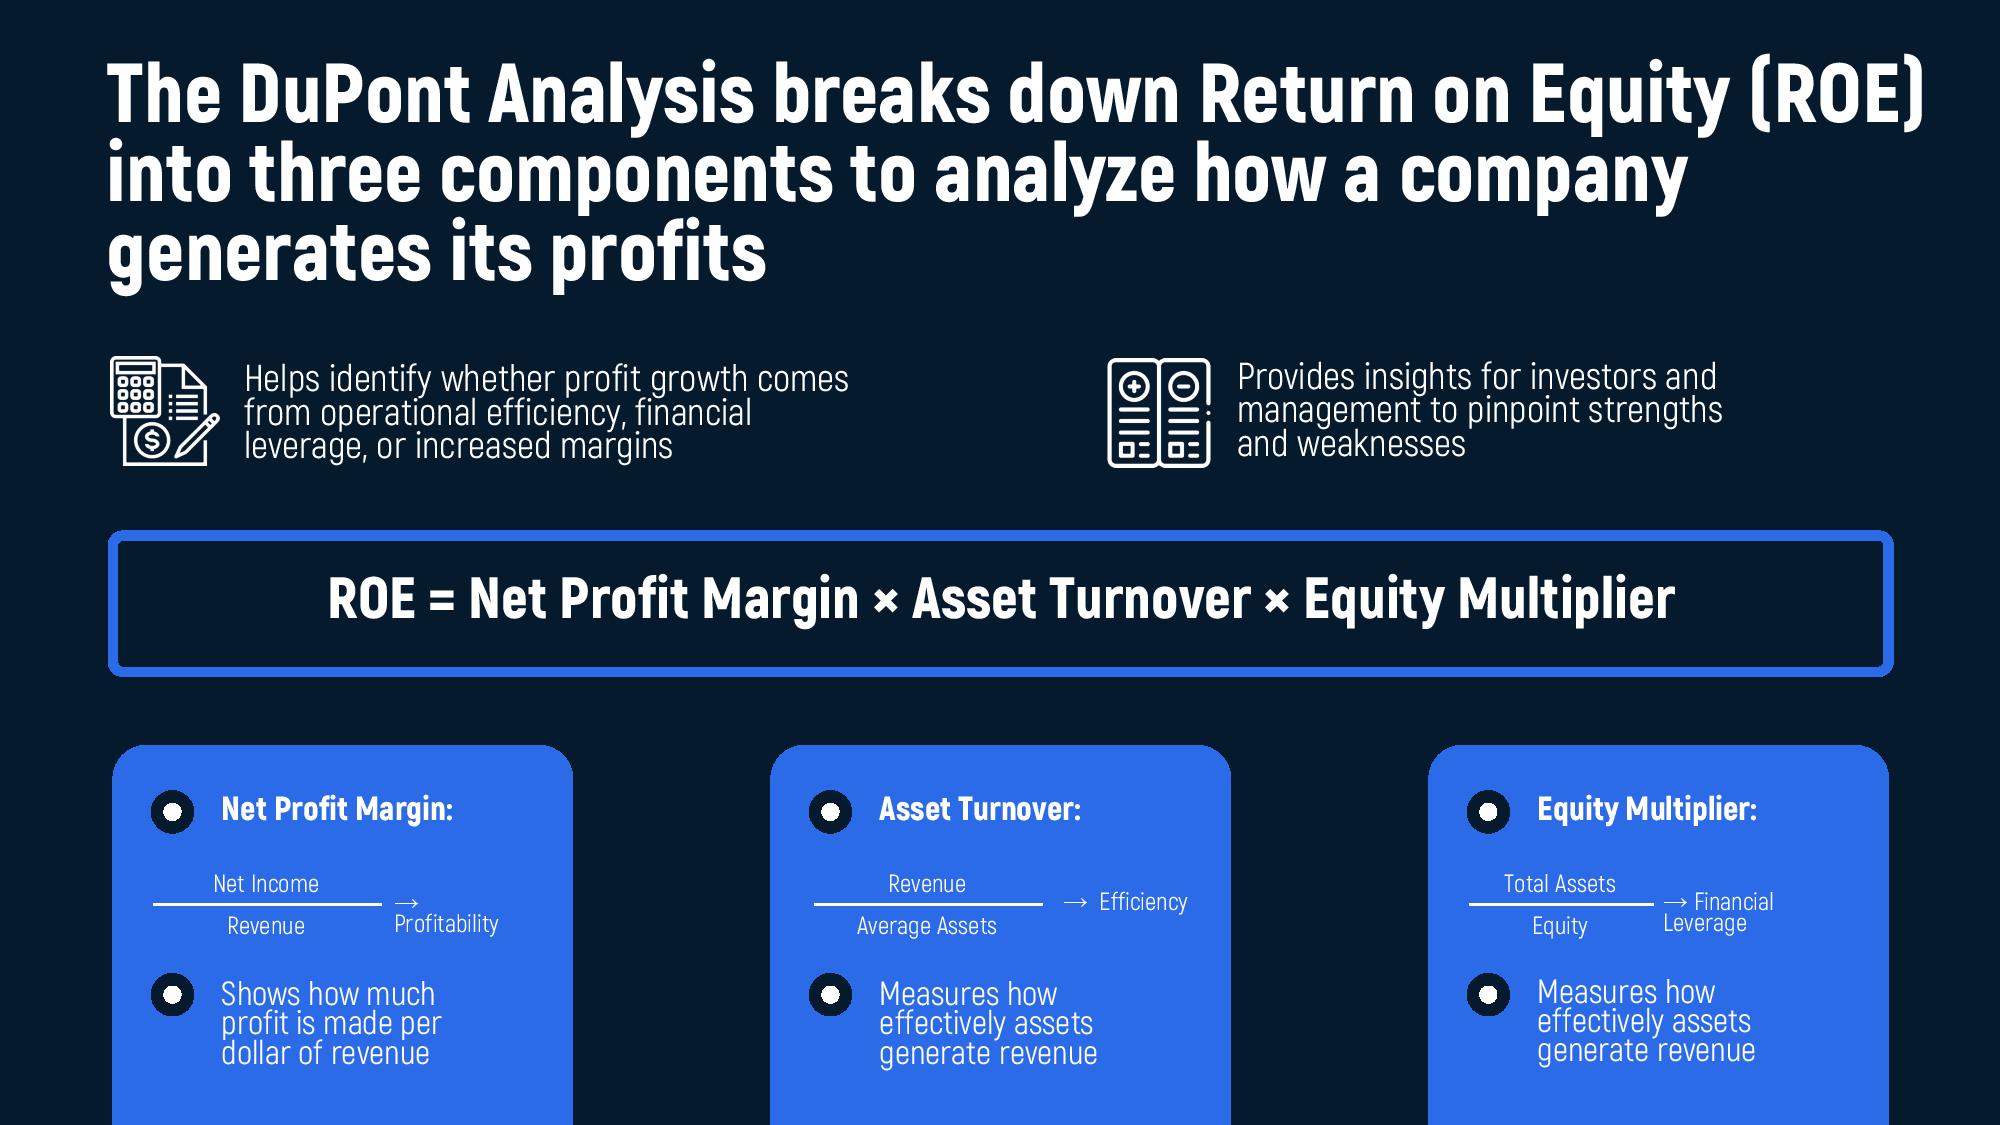
The DuPont approach extends ROE analysis by linking it to a company’s core financial dynamics. Instead of viewing returns as a single outcome, it examines the profitability of sales, how productively assets are used, and how the business is financed.
In its simplest form, the DuPont equation expresses ROE as the product of three dimensions, margin, turnover, and leverage, showing not only how much value is created but where it originates.
The DuPont equation is expressed as:
ROE = Net Profit Margin × Asset Turnover × Equity Multiplier
This breakdown allows analysts to see how profit is created, not just how much profit exists.
Let’s look at each component in detail 👇
1. Net Profit Margin: profitability lens
Reveals how much of each dollar of revenue remains as profit after expenses. A stable or rising margin usually points to effective pricing and cost management.
Net Profit Margin = Net Income
Revenue
This ratio shows how much of every dollar of sales turns into profit.
A higher margin means the company manages its costs effectively or has pricing power.
- High margin → strong cost control, brand strength, or pricing flexibility.
- Low margin → possible cost inefficiencies or price competition.
2. Asset Turnover: operational efficiency
Shows how productively the company’s assets generate sales. A high ratio means assets are being used actively to support growth, while a low one may signal underutilization or overinvestment.
Asset Turnover = Revenue
Average Total Asset
This ratio measures how efficiently a company uses its assets to generate revenue.
It reflects how productive the company’s investments are.
- High asset turnover → efficient asset use (e.g., retail or logistics).
- Low asset turnover → heavy investment in fixed assets (e.g., utilities or manufacturing).
3. Equity Multiplier: leverage effect
Equity Multiplier = Total Assets
Shareholders’ Equity
This measures the company’s financial leverage, how much of its assets are financed by debt rather than equity.
- A higher multiplier means the company relies more on debt.
- Moderate leverage can amplify returns, but excessive debt increases risk.
By multiplying these three factors, the DuPont Analysis reveals whether a company’s strong ROE comes from healthy operations or risky financing.
To fully understand where these numbers come from, it helps to see how the three main financial statements work together.
Read Linking the Statements Together: How Accounting Theory Connects Balance Sheet, P&L, and Cash Flow — it explains exactly how profitability, assets, and equity are connected under the hood.
For instance:
- A company with high profit margins and strong asset turnover indicates operational excellence.
- A company with weak margins but a very high equity multiplier may be debt-reliant, inflating ROE artificially.
Are You Ready for a Career a Top Company?
Answer three questions and get a personalized breakdown.
Step-by-step example of DuPont analysis
Let’s apply the DuPont formula to a real example to see how each component contributes to overall profitability.
Consider a hypothetical firm, Company A, posting an ROE of 15%. On the surface, this appears impressive — yet the DuPont framework reveals the forces behind that figure, showing whether it results from true operational strength or financial leverage.
Step 1. Start with the DuPont formula
ROE = Net Profit Margin × Asset Turnover × Equity Multiplier
Step 2. Plug in the numbers
Company A’s financial statements show the following:
- Net Profit Margin: 10%
- Asset Turnover: 0.8
- Equity Multiplier: 1.875
Now multiply these components:
ROE = 10% × 0.8 × 1.875 = 15%
Step 3. Interpret the results
Here’s what this breakdown tells us:
- The 10% Net Profit Margin indicates that Company A keeps $0.10 of profit from every dollar of revenue — showing healthy profitability.
- The 0.8 Asset Turnover suggests that the company generates $0.80 in revenue for every $1 of assets — fairly efficient, but not exceptional.
- The 1.875 Equity Multiplier shows a moderate use of leverage — the company uses some debt, but not excessively.
Together, these factors combine to produce a 15% ROE.
This result suggests a balanced performance, where operational efficiency and profitability contribute more to returns than risky leverage.

Step 4. Why This Matters
By using the DuPont breakdown, analysts can pinpoint the source of performance:
- If profitability drops, ROE might fall even if efficiency and leverage stay constant.
- If asset turnover improves, ROE can rise even with the same margin.
- If leverage increases, ROE may grow — but so does financial risk.
This granular view helps management decide where to focus improvement efforts: on margins, asset utilization, or capital structure.
Interpreting changes in ROE components
Once you’ve calculated the DuPont breakdown, the next step is to understand what changes in each component actually mean.
A shift in ROE could signal operational improvement — or growing financial risk. The DuPont framework helps you distinguish between the two.
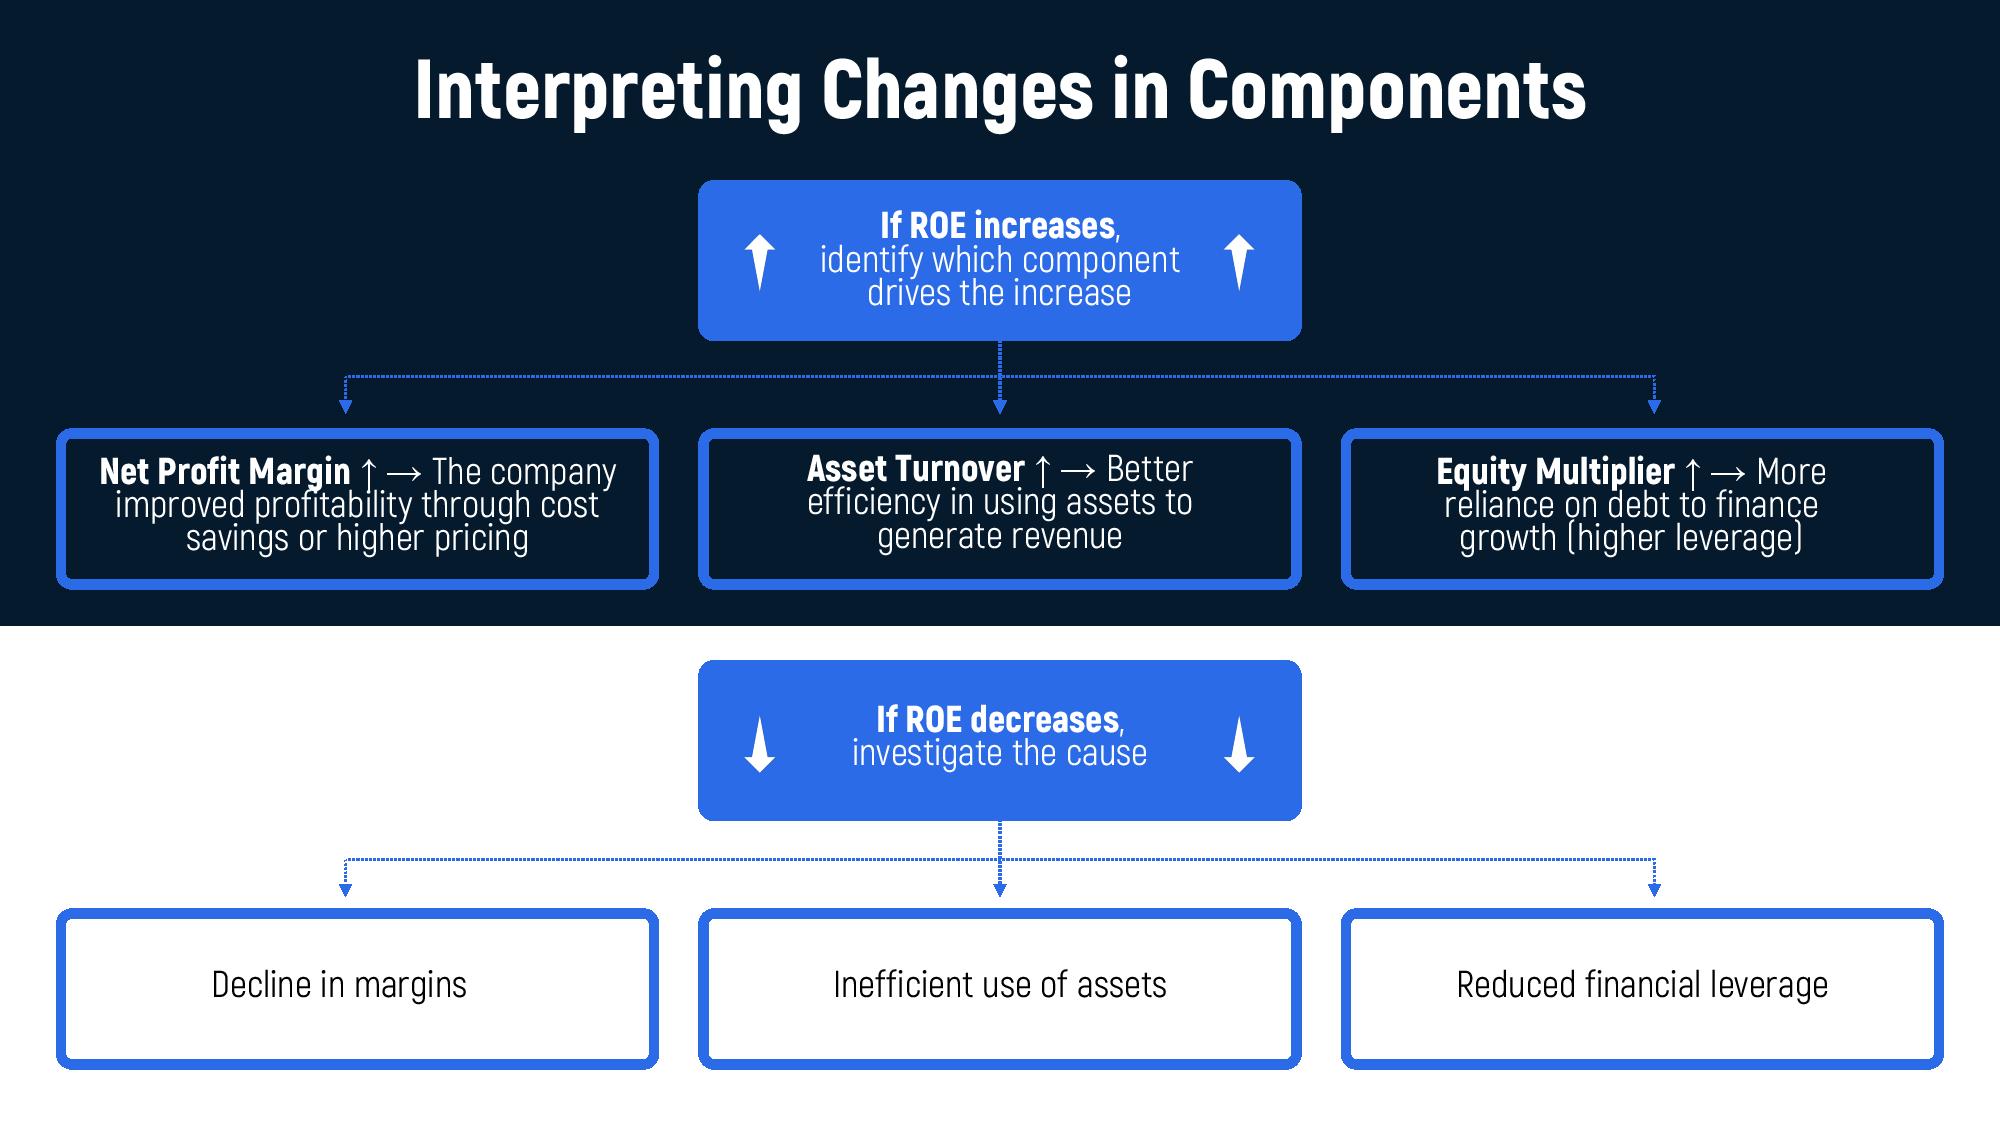
When ROE increases
A rising ROE doesn’t automatically mean the company is performing better – it’s essential to understand what’s driving the change. Growth in ROE may result from higher margins, better use of assets, or increased borrowing:
- Higher net profit margin → Improved profitability
The company is either reducing costs, raising prices, or benefiting from economies of scale.
Example: A retailer improving margins by optimizing supply chain costs.
- Higher asset turnover → Better efficiency
Assets are being used more effectively to generate sales.
Example: A logistics firm that increases revenue by using its trucks more efficiently.
- Higher equity multiplier → More leverage
The company is financing growth with additional debt. This can boost returns — but also risk.
Example: A manufacturer taking on debt to fund expansion, which temporarily boosts ROE.
When ROE decreases
A decline in ROE signals the opposite — and pinpointing the cause helps determine whether it’s a short-term issue or a structural problem:
- Falling margins may result from rising costs, pricing pressure, or lower demand.
- Weak asset turnover might reflect idle assets, slow sales, or overinvestment in capacity.
- Reduced leverage could mean the company is deleveraging, which lowers ROE but also reduces risk — sometimes a healthy sign.
Healthy vs Risky ROE Growth
| Driver | Impact on ROE | Implication |
|---|---|---|
|
Higher Profit Margin |
↑ ROE |
Positive — sustainable growth through operations
|
|
Higher Asset Turnover |
↑ ROE |
Positive — efficiency improvement |
|
Higher Equity Multiplier |
↑ ROE |
Risky — debt-driven growth increases volatility |
A well-managed company should aim for ROE growth led by margin expansion and efficiency gains, not excessive leverage.
Insights from DuPont analysis
The true power of the DuPont framework lies not just in the formula — but in the insights it provides about a company’s strategic and financial health.
By breaking down ROE into its three components, investors and managers can understand how a business creates value and whether that value creation is sustainable.
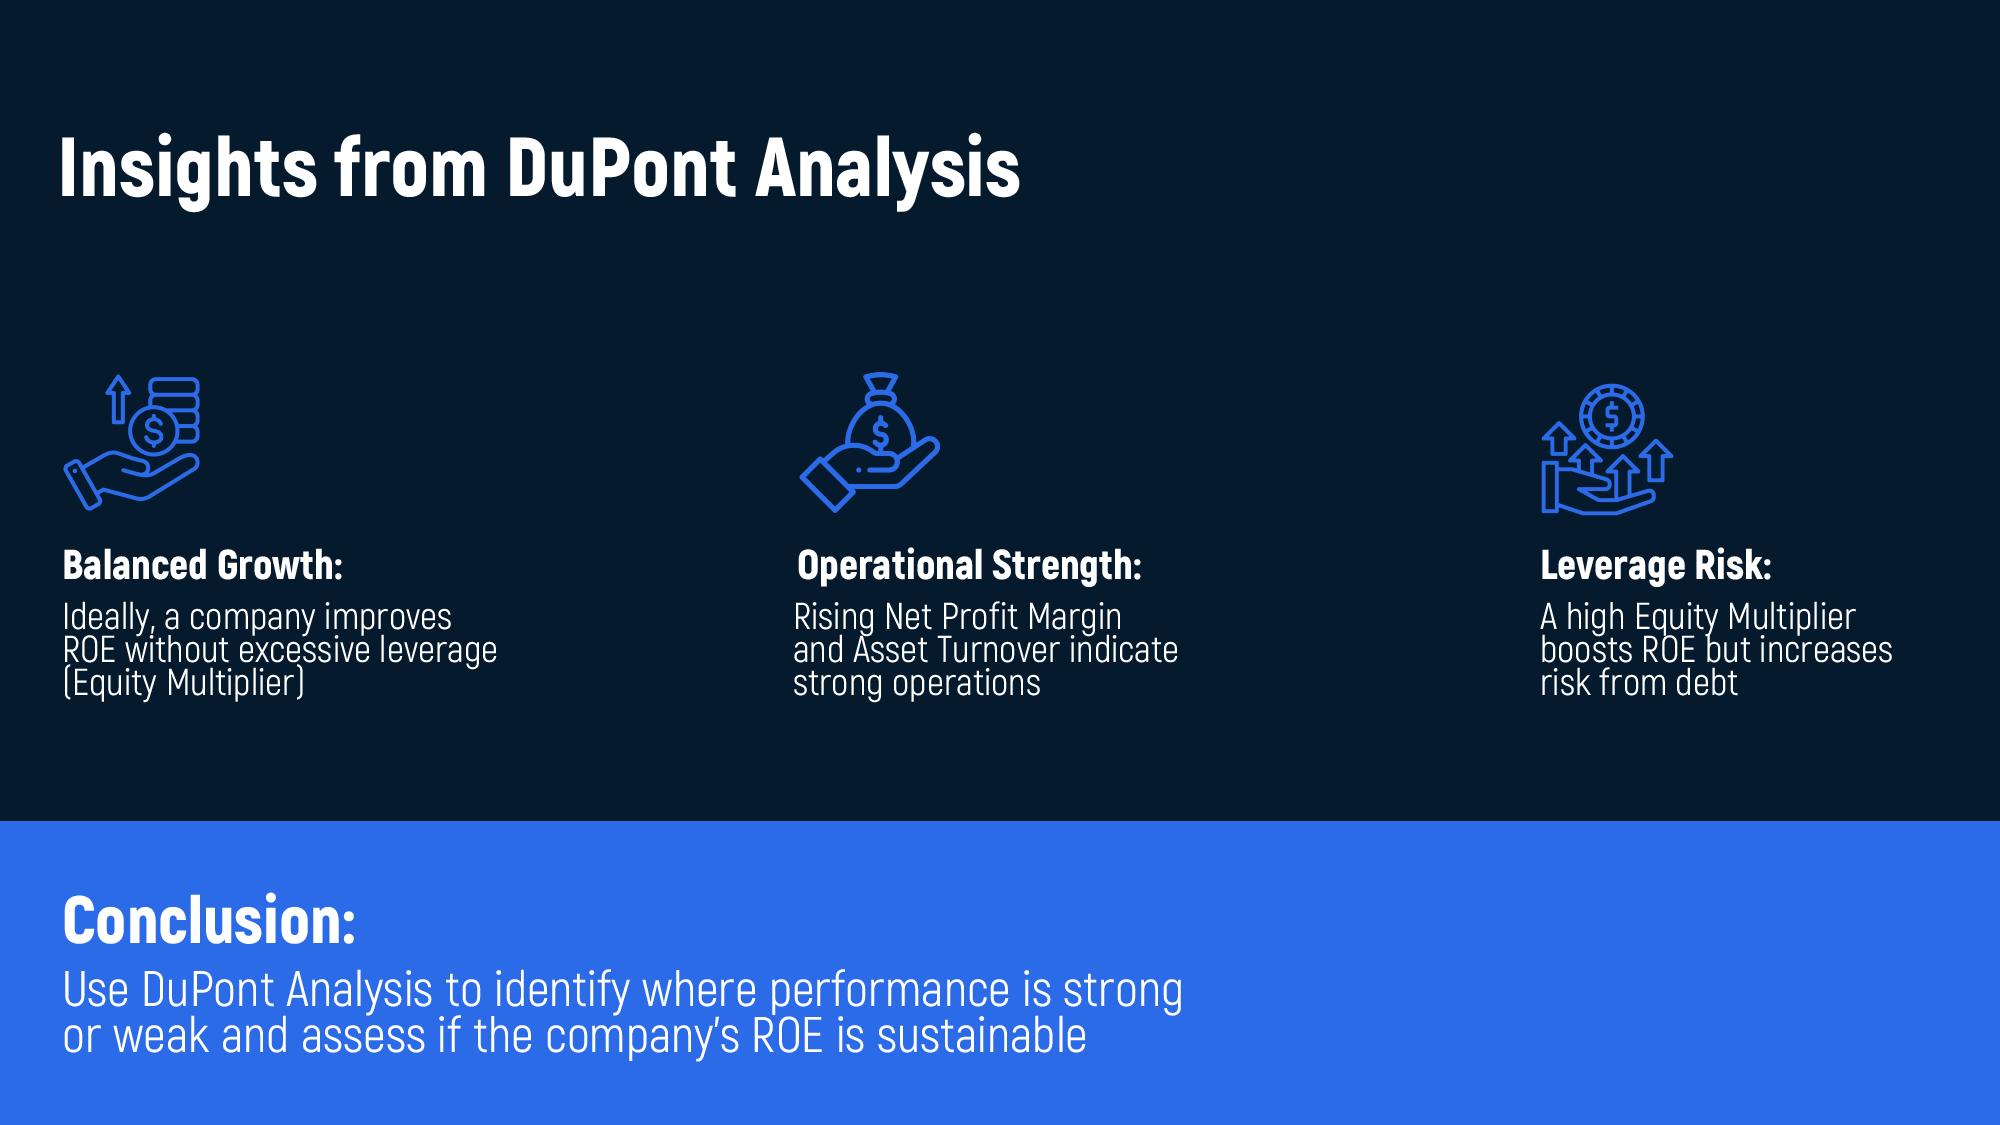
1. Balanced growth: the ideal scenario
A strong company improves its Return on Equity by enhancing profitability and efficiency — not by taking on more debt. When both Net Profit Margin and Asset Turnover increase while leverage stays stable, ROE growth is healthy and sustainable.
Example: A technology firm improving software margins and scaling recurring revenue without increasing its debt load.
2. Operational strength: efficiency and profitability
When a company’s Net Profit Margin and Asset Turnover move in the right direction, it signals operational excellence. This combination shows that management is controlling costs, pricing effectively, and utilizing assets efficiently.
Such businesses are typically leaders in their industries and attract long-term investors.
3. Leverage risk: when growth comes from debt
A rising Equity Multiplier may temporarily boost ROE, but it introduces higher financial risk. If too much of the company’s growth is funded through debt, a downturn in sales or rising interest rates can quickly erode profits.
This type of ROE growth looks strong on paper — but can mask underlying vulnerability.
4. The sustainability check
Investors use the DuPont model to assess whether a company’s ROE can be maintained over time. A company relying primarily on leverage will face limits eventually, while one improving efficiency and margins can grow more steadily.
Finance teams also use this insight internally to prioritize initiatives — whether it’s cutting costs, improving asset utilization, or optimizing capital structure.
5. The strategic takeaway
The best-performing businesses strike a balance among the three levers of ROE:
- Profitability (margin control)
- Efficiency (asset management)
- Leverage (financial structure)
When these elements work together, the company achieves durable profitability without compromising stability.
Practical applications
The DuPont Analysis isn’t just an academic formula — it’s a practical decision-making tool used across corporate finance, investing, and management.
For investors
- Helps identify why a company’s ROE is high or low — whether it’s due to true profitability or financial engineering.
- Enables peer comparison by isolating drivers of performance. Two firms may have the same ROE, but one achieves it through efficient operations, while the other relies on debt.
For management teams
- Provides a diagnostic framework to improve results:
-If margins are low → focus on pricing and cost optimization.
-If asset turnover is weak → review capital utilization and productivity.
-If leverage is too high → reduce debt exposure and strengthen equity.
- Serves as a communication tool for explaining financial performance to stakeholders and investors.
For analysts and consultants
- DuPont is essential for strategic benchmarking.
-It identifies operational inefficiencies, highlights risk exposure, and helps evaluate sustainability of returns.
- It also connects profitability analysis with balance sheet management, bridging accounting and strategy.
These analytical skills form the backbone of many finance careers, especially in deal-making and valuation.
If you’re curious how this translates into the real world of finance, read Investment Banking: What It Is, How It Works, and How to Start — a practical introduction to one of the most dynamic areas where DuPont-style analysis is used daily.
Conclusion
The DuPont framework reframes ROE as a story about how value is created inside a business. By linking margins, efficiency, and leverage, it exposes the real structure behind financial performance.
Companies that improve returns through stronger operations and smarter capital use, rather than excessive borrowing, tend to deliver more stable, sustainable growth.
For analysts, the DuPont approach is not just arithmetic; it’s a lens through which profitability, efficiency, and risk can be understood as parts of one financial ecosystem.
If you’re aiming to apply your financial analysis skills in investment banking or corporate finance roles, don’t miss How to Write Effective Investment Banking Cover Letters.
It walks you through how to present your analytical mindset and deal understanding in a way that resonates with top-tier recruiters.
The most successful companies grow ROE through operational strength and efficient capital use, not excessive debt. For investors, this means identifying sustainable returns; for managers, it means knowing exactly where to focus improvement efforts.
In essence, DuPont Analysis tells a story:
- A story of how profit is generated,
- How efficiently assets are deployed,
- And how risk is managed through capital structure.
Mastering this framework enables you to move beyond surface-level ratios and uncover the real drivers behind financial performance. It’s not just a calculation — it’s one of the most powerful lenses for evaluating the quality and sustainability of a company’s growth.
Ready to turn financial theory into real-world expertise?
Join The Thinksters Investment Banking Course — a step-by-step program where you’ll learn valuation, modeling, and deal analysis directly from industry professionals.
