
Introduction
When evaluating a company’s performance, raw financial statements only tell part of the story. Revenue, expenses, assets, and liabilities provide valuable data, but to truly understand how well a business is operating, analysts rely on financial ratios. These ratios transform accounting numbers into insights about efficiency, liquidity, profitability, risk, and valuation.
Financial ratios are at the core of investment banking, equity research, and corporate finance. They allow professionals to compare companies across industries, measure trends over time, and assess the impact of strategic decisions. For example, a bank might use liquidity ratios to test whether a borrower can repay short-term debt, while an equity analyst might rely on valuation ratios like P/E or EV/EBITDA to determine if a stock is undervalued.
In this article, we will:
- Define what financial ratios are and why they matter.
- Break down the five key categories: Activity, Liquidity, Solvency, Profitability, and Valuation ratios.
- Show the formulas and interpretation for the most common ratios.
- Discuss practical applications in forecasting, valuation, and investment analysis.
- Highlight the limitations of relying solely on ratios.
By the end, you’ll have a clear framework for analyzing business performance through financial ratios — a skill that is essential both for interviews and for real-world finance.
What are financial ratios?
A financial ratio is a relationship between two numbers taken from a company’s financial statements. By comparing items on the income statement, balance sheet, or cash flow statement, ratios provide insights that raw figures alone cannot.
For example:
- Knowing a company earned $10 million in net income is useful, but knowing its return on equity (ROE) is 15% tells you how efficiently it is generating profits relative to shareholder investment.
- Similarly, $50 million in debt might sound large, but the debt-to-equity ratio reveals whether that leverage is risky compared to the company’s equity base.
The five major categories of ratios
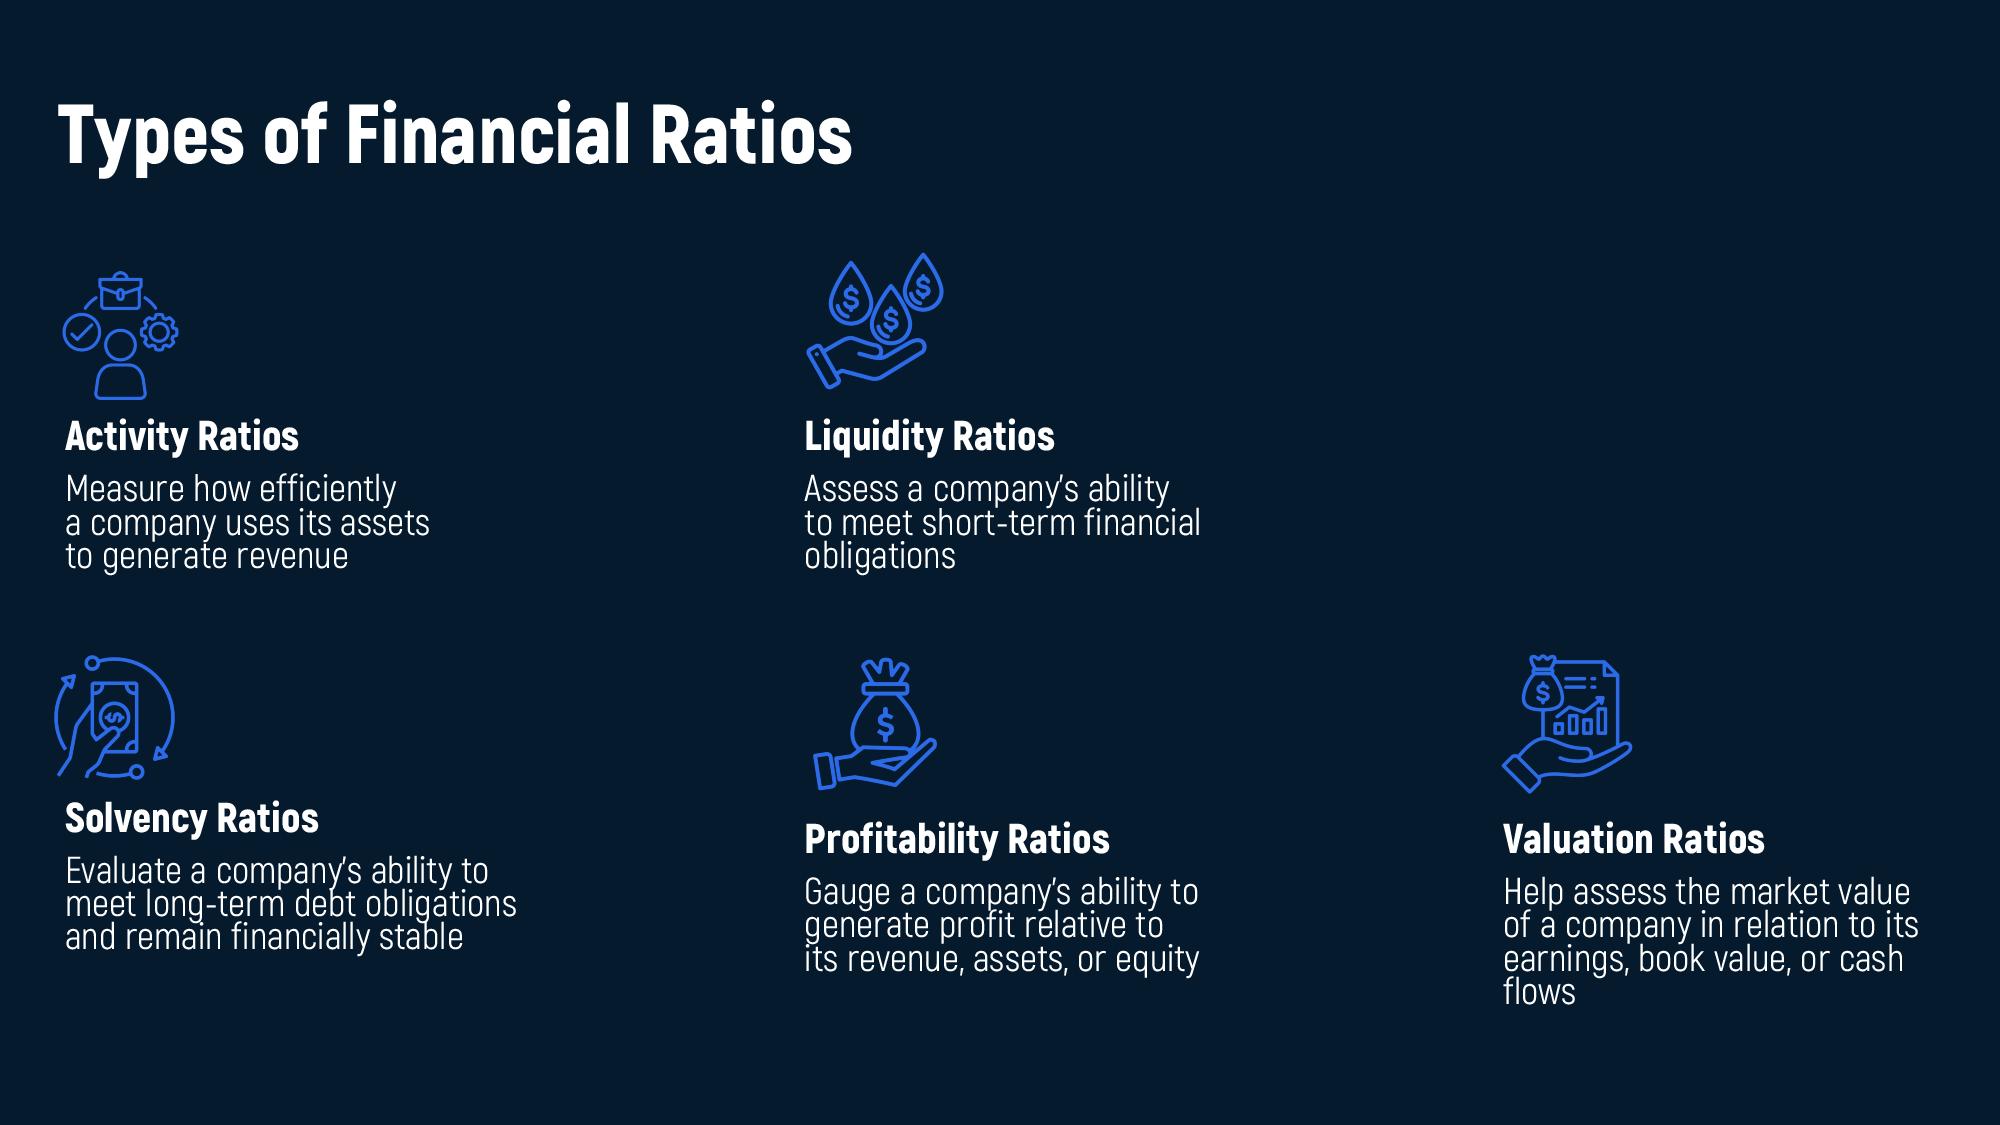
Financial ratios are typically grouped into five categories, each providing a different lens on performance:
- Activity Ratios: Efficiency of asset usage (e.g., inventory turnover, accounts receivable turnover).
- Liquidity Ratios: Ability to meet short-term obligations (e.g., current ratio, quick ratio).
- Solvency Ratios: Long-term stability and debt management (e.g., debt-to-equity, interest coverage).
- Profitability Ratios: Capacity to generate profits from sales, assets, or equity (e.g., net margin, ROA, ROE).
- Valuation Ratios: Market perspective on value relative to fundamentals (e.g., P/E, P/B, EV/EBITDA).
Activity ratios: measuring efficiency
Activity ratios show how efficiently a company uses its assets to generate revenue. They focus on turnover metrics, which track how quickly resources like inventory or receivables are converted into sales or cash.
1. Inventory turnover
Formula:
Inventory Turnover = Cost of Goods Sold (COGS)
Average Inventory
Interpretation:
- A higher ratio means inventory is sold and replaced more frequently — indicating efficiency.
- A lower ratio may suggest overstocking, slow sales, or obsolete inventory.
Example:
If a company has an inventory turnover of 6, it means it sells and replenishes its inventory six times per year.
2. Accounts receivable turnover
Formula:
AR Turnover = Net Credit Sales
Average Accounts Receivable
Interpretation:
- Measures how quickly a company collects payments from customers.
- A higher ratio = efficient collections and strong cash flow.
- A lower ratio = potential credit risk or lenient payment terms.
3. Asset turnover
Formula:
Asset Turnover = Net Sales
Average Total Assets
Interpretation:
- Indicates how effectively a company uses its assets to generate sales.
- A higher ratio means stronger efficiency.
- Industry-dependent: asset-light companies (tech, consulting) often have higher turnover than asset-heavy ones (manufacturing, airlines).
Together, these ratios provide insight into operational efficiency. Analysts use them to spot whether a business is managing resources effectively or tying up too much capital in inventory and receivables.

Liquidity ratios: short-term financial health
Liquidity ratios assess whether a company can meet its short-term obligations using its current assets. These measures are crucial for creditors, investors, and managers to evaluate financial flexibility.
1. Current ratio
Formula:
Current Ratio = Current Assets
Current Liabilities
Interpretation:
- A ratio >1 means the company has more current assets than liabilities — generally positive.
- A ratio <1 indicates potential liquidity issues.
- Industry norms matter: some sectors operate comfortably with lower liquidity.
2. Quick ratio (Acid-rest ratio)
Formula:
Quick Ratio = Current Assets – Inventory
Current Liabilities
Interpretation:
- Stricter than the Current Ratio because it excludes inventory (which may not be quickly convertible to cash).
- A higher ratio shows stronger ability to meet obligations without selling inventory.
3. Cash Ratio
Formula:
Cash Ratio = Cash + Cash Equivalents
Current Liabilities
Interpretation:
- The most conservative liquidity ratio.
- Measures if the company can cover liabilities using only cash and equivalents.
- Often very low in practice; used mainly for stress testing liquidity risk.
Together, these ratios provide a short-term financial health check. While the Current Ratio gives a general view, the Quick and Cash Ratios provide deeper insights into true liquidity strength.
Solvency ratios: long-term stability
Solvency ratios evaluate a company’s ability to meet long-term debt obligations and remain financially stable. They focus on leverage and the firm’s capacity to service debt through earnings.
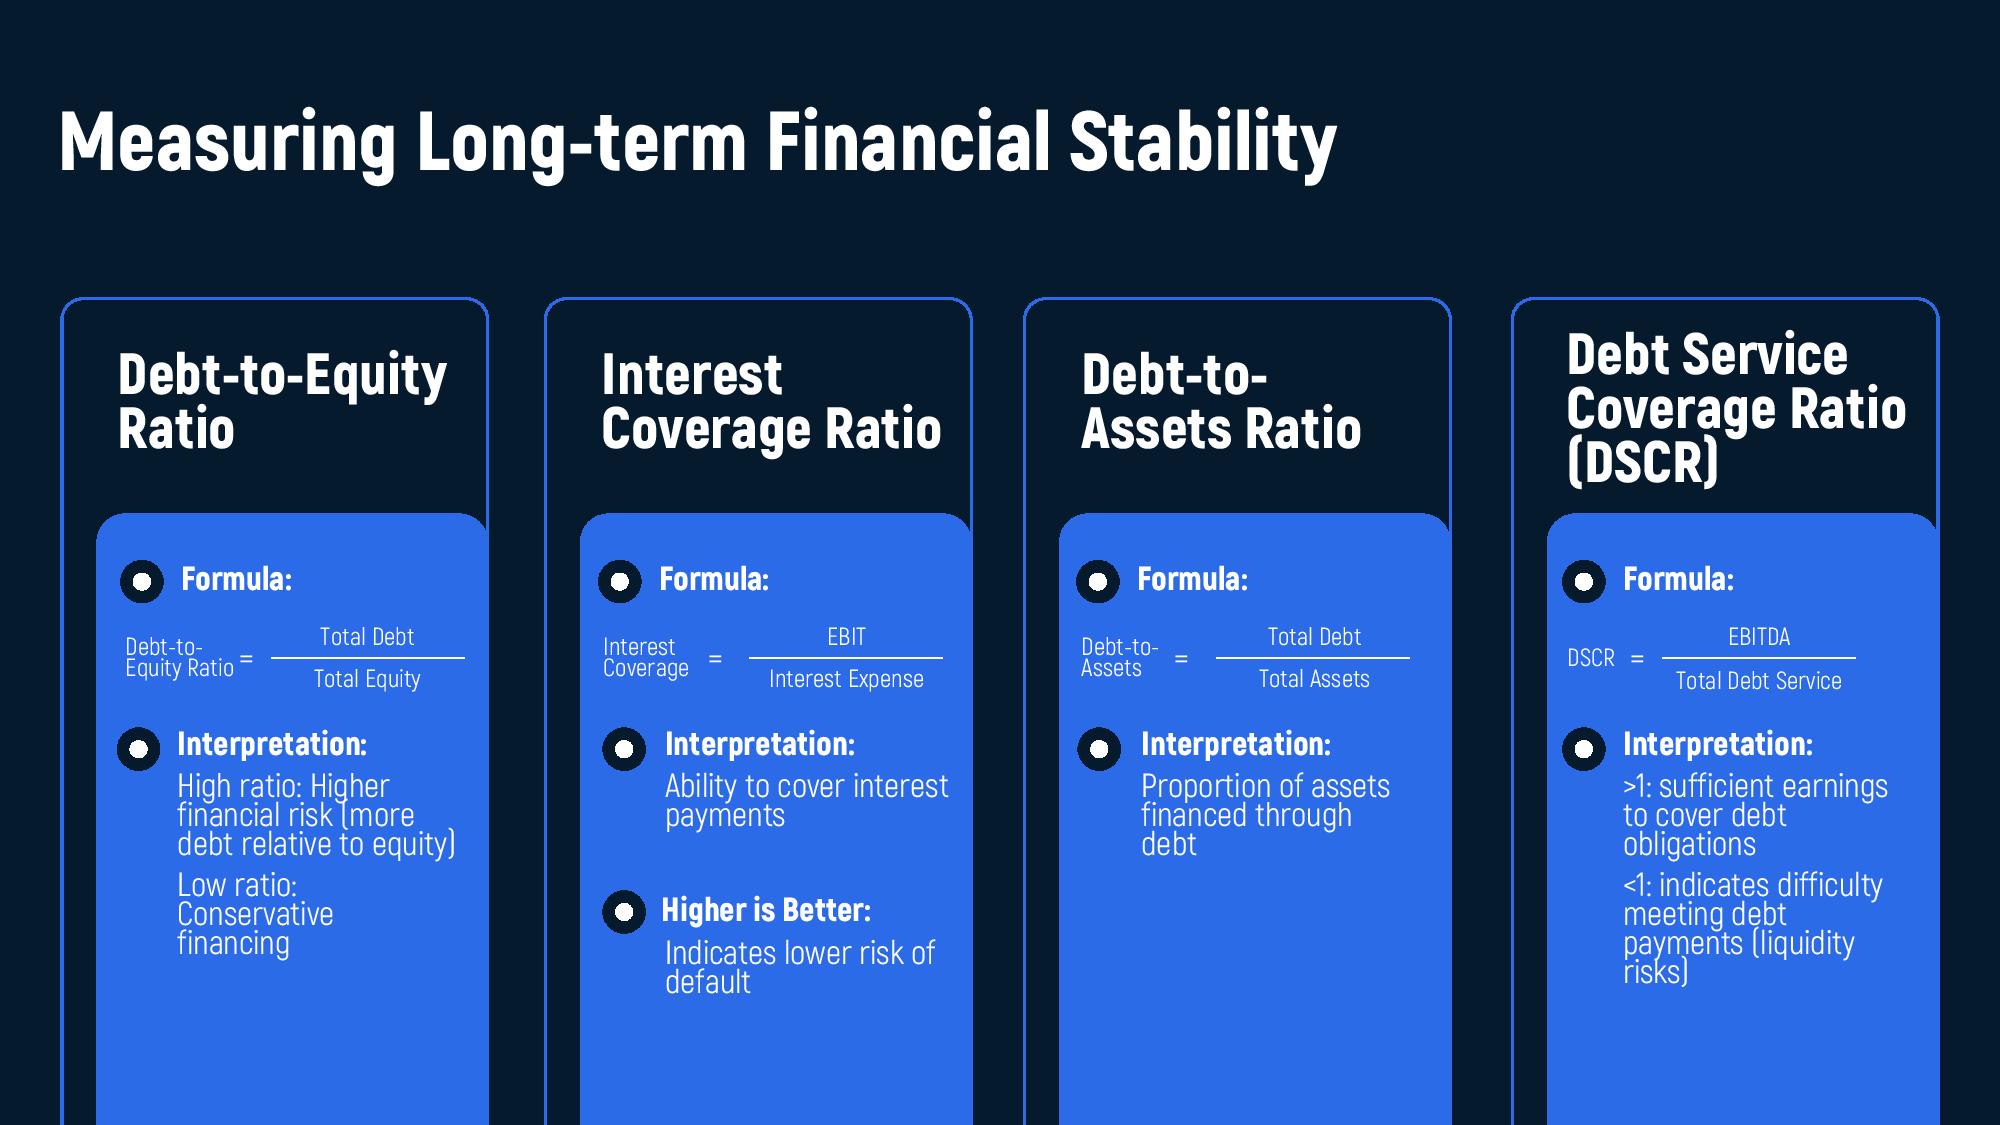
1. Debt-to-equity ratio
Formula:
Debt-to-Equity = Total Debt
Total Equity
Interpretation:
- A high ratio means higher financial risk (more debt relative to equity).
- A low ratio indicates conservative financing and lower risk.
- Analysts compare this ratio across peers in the same industry.
2. Debt-to-assets ratio
Formula:
Debt-to-Assets = Total Debt
Total Assets
Interpretation:
- Shows what proportion of assets are financed through debt.
- A higher ratio = greater reliance on borrowed funds.
- A lower ratio = more assets financed through equity.
3. Interest coverage ratio
Formula:
Interest Coverage = EBIT
Interest Expense
Interpretation:
- Measures how easily a company can pay interest on its debt.
- Higher is better — indicates strong earnings relative to interest costs.
- <1 suggests difficulty covering interest, a red flag for creditors.
4. Debt service coverage ratio (DSCR)
Formula:
DSCR = EBITD A
Total Debt Service
Interpretation:
- Tests whether operating cash flows are sufficient to cover all debt obligations (interest + principal).
- DSCR > 1: sufficient earnings to cover debt payments.
- DSCR < 1: indicates liquidity stress and potential default risk.
Together, these solvency ratios reveal the company’s financial leverage and ability to sustain debt. Investors and lenders rely on them heavily when assessing creditworthiness.
Are You Ready for a Career a Top Company?
Answer three questions and get a personalized breakdown.
Profitability ratios: measuring performance
Profitability ratios assess how effectively a company generates profit relative to its revenue, assets, or equity. These ratios are central to evaluating business performance and investment attractiveness.
1. Net profit margin
Formula:
Net Profit Margin = Net Income
Revenue
Interpretation:
- Shows the percentage of revenue converted into profit.
- A higher margin indicates cost efficiency and strong pricing power.
- Useful for comparing profitability across competitors in the same industry.
2. Return on Assets (ROA)
Formula:
ROA = Net Income
Average Total Assets
Interpretation:
- Measures how efficiently a company uses its assets to generate profit.
- Higher ROA = strong asset utilization.
- Capital-intensive industries (e.g., airlines, utilities) naturally have lower ROA than asset-light sectors (e.g., software).
3. Return on Equity (ROE)
Formula:
ROE = Net Income
Shareholders’ Equity
Interpretation:
- Measures profitability relative to shareholder investment.
- A higher ROE suggests efficient use of equity capital.
- Extremely high ROE can indicate aggressive leverage — needs to be analyzed together with solvency ratios.
Together, these ratios give a clear picture of profitability and operational performance. They are key metrics for investors, managers, and analysts when comparing companies.

Valuation ratios: assessing market value
Valuation ratios connect a company’s market value to its financial fundamentals. They are widely used in equity research, investment banking, and portfolio management to judge whether a stock is fairly priced, overvalued, or undervalued.
1. Price-to-Earnings (P/E) Ratio
Formula:
P/E Ratio = Share Price
Earnings Per Share (EPS)
Interpretation:
- A high P/E suggests that investors expect strong future growth.
- A low P/E may signal undervaluation or weak growth prospects.
- Best used when comparing companies within the same industry.
2. Price-to-Book (P/B) Ratio
Formula:
P/B Ratio = Share Price
Book Value Per Share
Interpretation:
- Compares market value with accounting book value.
- P/B > 1: Market values the company above its book value (often due to growth potential or intangible assets).
- P/B < 1: Could indicate undervaluation or distressed financials.
3. EV/EBITDA
Formula:
EV /EBITDA = Enterprise Value (EV)
EBITDA
Interpretation:
- A capital-structure-neutral valuation metric (since EV accounts for both debt and equity).
- Lower multiples may indicate undervaluation, but also potential business weakness.
- Commonly used in M&A to value companies regardless of financing structure.
Valuation ratios bridge the gap between financial performance and market expectations. They are especially important for investors making buy/sell decisions and for bankers conducting fairness opinions in transactions.

Practical applications of financial ratios
Financial ratios are not just abstract calculations — they are practical tools used across finance. Here’s how professionals apply them:
1. Equity research
- Analysts use profitability and valuation ratios (e.g., ROE, P/E, EV/EBITDA) to identify undervalued or overvalued stocks.
- Ratios allow them to compare a company’s performance with peers and justify buy/hold/sell recommendations.
2. Credit analysis
- Banks and rating agencies focus on liquidity and solvency ratios (e.g., Current Ratio, DSCR, Interest Coverage) to assess whether a borrower can meet obligations.
- Ratios serve as early warning signals of financial distress.
- In M&A and IPOs, bankers use ratios to benchmark companies against comparable firms (“comps analysis”).
- Valuation ratios like EV/EBITDA and P/B are essential in fairness opinions and pricing transactions.
4. Corporate finance & management
- Executives track activity ratios (e.g., inventory turnover) to improve efficiency and working capital management.
- Profitability ratios guide decisions on cost-cutting, pricing, or capital allocation.
Conclusion
Financial ratios are the foundation of business analysis. They transform financial statement data into meaningful insights about efficiency, liquidity, leverage, profitability, and market value.
- Activity ratios show how well assets are used.
- Liquidity ratios reveal short-term financial health.
- Solvency ratios highlight long-term stability.
- Profitability ratios measure performance and returns.
- Valuation ratios link accounting results to market expectations.
But ratios are tools, not answers. They must be interpreted in the context of industry benchmarks, historical trends, and broader market conditions. A “high” or “low” ratio alone does not tell the full story.
For professionals in investment banking, equity research, corporate finance, or management, mastering financial ratios means being able to move from raw numbers to actionable insights. For students and interview candidates, it provides a strong foundation for technical questions and case studies.
